
Xintra - .NET Crash Dump Analysis
Effective memory dump analysis from a security perspective, particularly the w3wp.exe and sqlservr.exe is crucial when investigating attacks involving .NET applications targeting IIS. -Assuming you’re lucky enough to find the compromised server alive :” -
In this post, I will walk through my process while solving this awesome lab from Xintra which features user-mode dumps related to two CVEs (Ivanti EPM SQLi RCE and a SharePoint Pre-Auth RCE chain), explaining key concepts along the way, not throwing commands and answers, hope this approach helps someone learn something new.

Lab Tips:
- Understand the CVEs technical details and there poc.
- Have a solid grasp of windows internals, some .Net and IIS concepts.
- Leverage your googlefu skills when get stuck.
- With any lab, prioritize searching and learning over quick completion (it’s not a cyberdrill).
- Check the Resources section below.
1. CVE-2024-29824
Xintra Scoping Note & Context
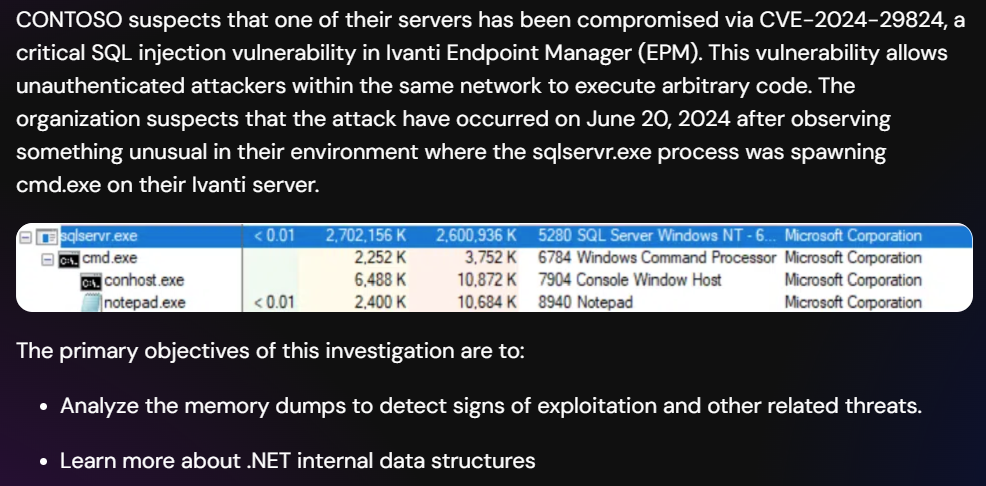
Ivanti Endpoint Manager (EPM) allows centralized device management using IIS for web functionalities and SQL Server for database operations. The IIS Worker Process (w3wp.exe) handles HTTP requests, while SQL Server (sqlservr.exe) manages database operations.
CVE-2024-29824 is a SQL injection vulnerability that leads to RCE, allowing an attacker on the same network to exploit the Core server through a vulnerable IIS endpoint. This affects both the web layer (w3wp.exe) and the database layer (sqlservr.exe), making dump files from these processes key to analyzing the attack.
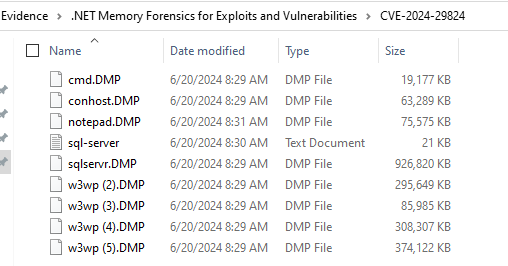
On Xintra, The first CVE folder contains several user-mode dumps -some of the
w3wp.exedumps are legitimate and not related to the CVE-, I will begin by explaining whatApplication Pool Identityis and key aspects of the IIS Worker process. Following that, I’ll move into the memory dump analysis using WinDbg.
Application Pool ?
Before analyzing the memory dump and assessing the impact let’s explain the Application Pool Identity :
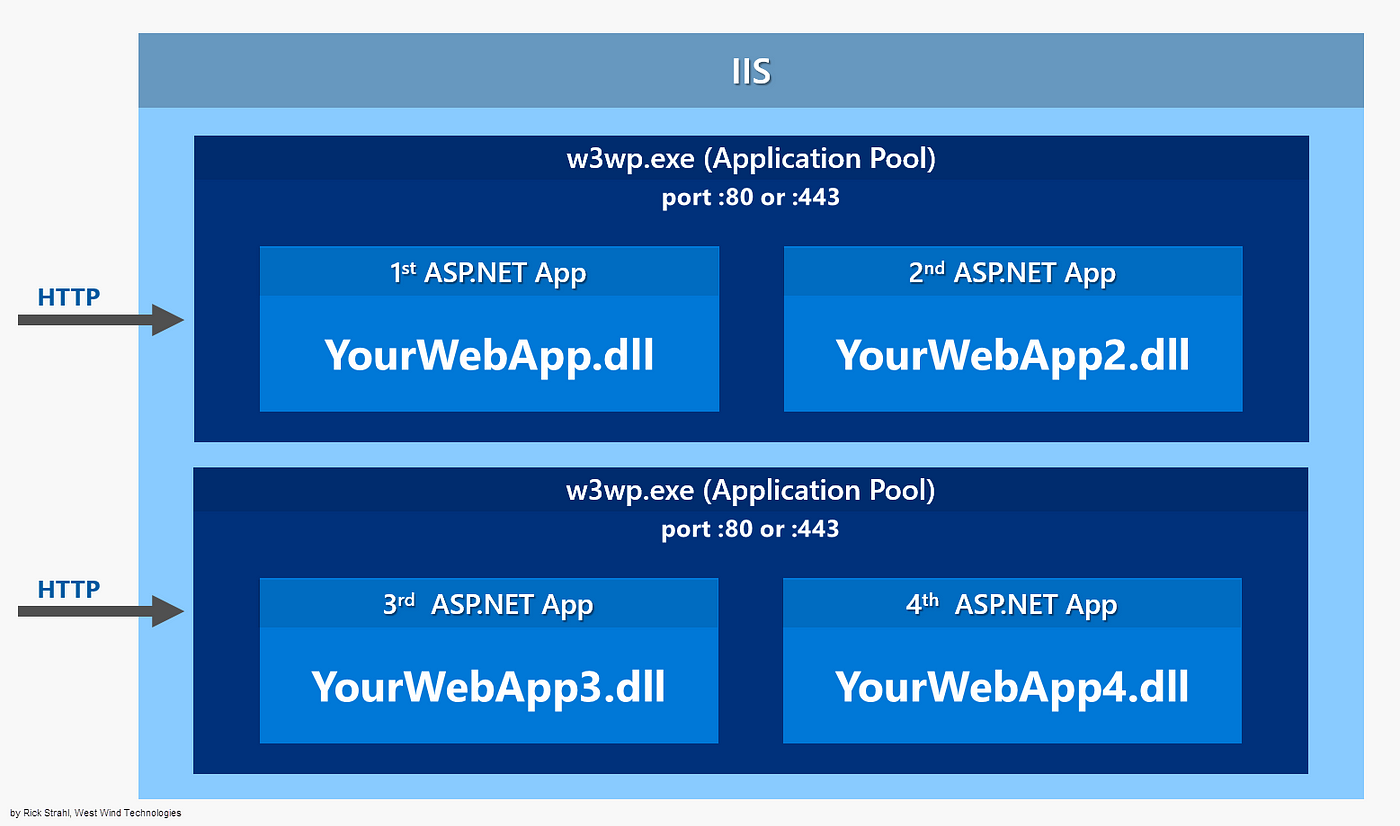
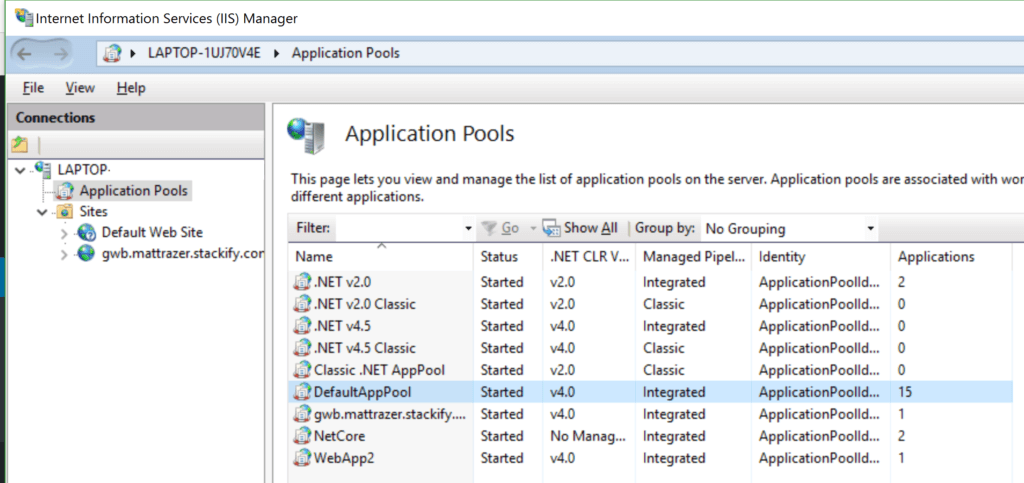
Web applications running on Microsoft IIS utilize IIS worker processes, which run as
w3wp.exe. There can be multiple instances of this process per computer. Each Application Pool is a container that hosts specific services, and it runs in its own w3wp.exe process, providing isolation and resource management.When a new Application Pool is created in IIS, it uses an account defined by IIS (usually called “ApplicationPoolIdentity”). This identity is similar to an account you would use to log into your Windows machine. It allows an application pool to run under a unique account without the need to create or manage domain or local accounts.
w3wp Dump Information
Fortunately, the lab comes pre-configured with symbols and all the necessary WinDbg extensions.
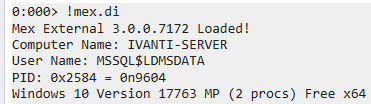
After loading one of the w3wp dump files in WinDbg, let’s start by using the MEX plugin and display the dump information (user & machine names, etc.) with the command !mex.dumpinfo (!mex.di)
There are other commands that can display dump info as well, such as the !peb command, which provides a formatted view of the information in the Process Environment Block (PEB). You can also use the plugin netext by loading it via .load netext then !windex to index the objects and finally !wvar to list the process environment variables.
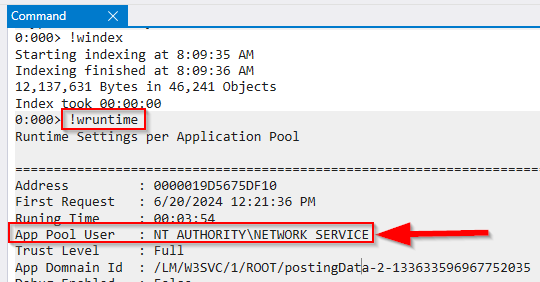
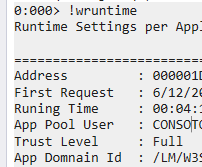
To identify the “user account” we dump all active Http Runtime information, This is easily done with !wruntime.
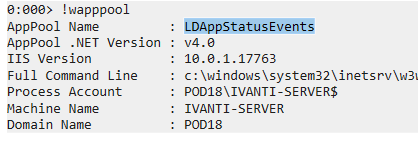
in the w3wp (5).DMP file, Application Pool name can be gathered with !wapppool (used to display information about app pool and IIS)
HTTP-specific information
The customer’s initial triage identified a malicious “python-requests/2.24.0” user agent. To locate it in which dump file we can figure it out via an unintended way by opening the dump files in notepad++ and search for python or the endpoint EventHandler.asmx, However let’s continue the nerdy way:
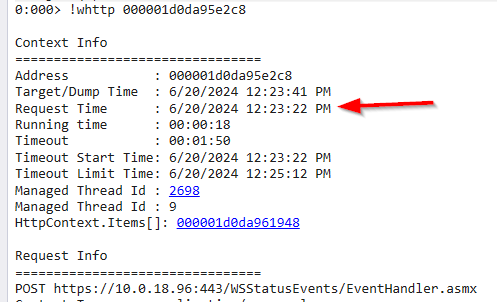
from the cve technical analysis, we know the vulnerability was exploited via the endpoint /EventHandler.asmx so we need to find the URLs from the HttpContext objects, this can be listed easily using the plugin netext with the command !whttp
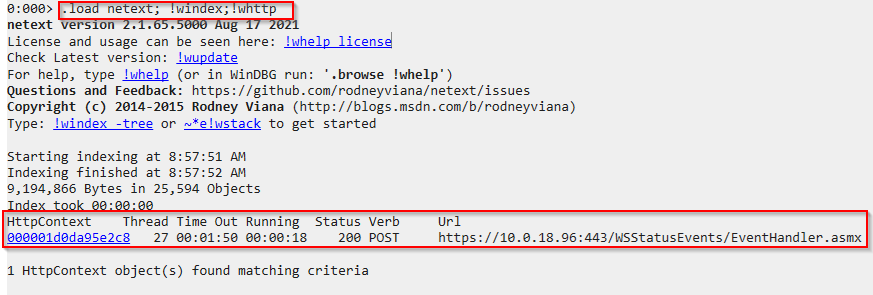
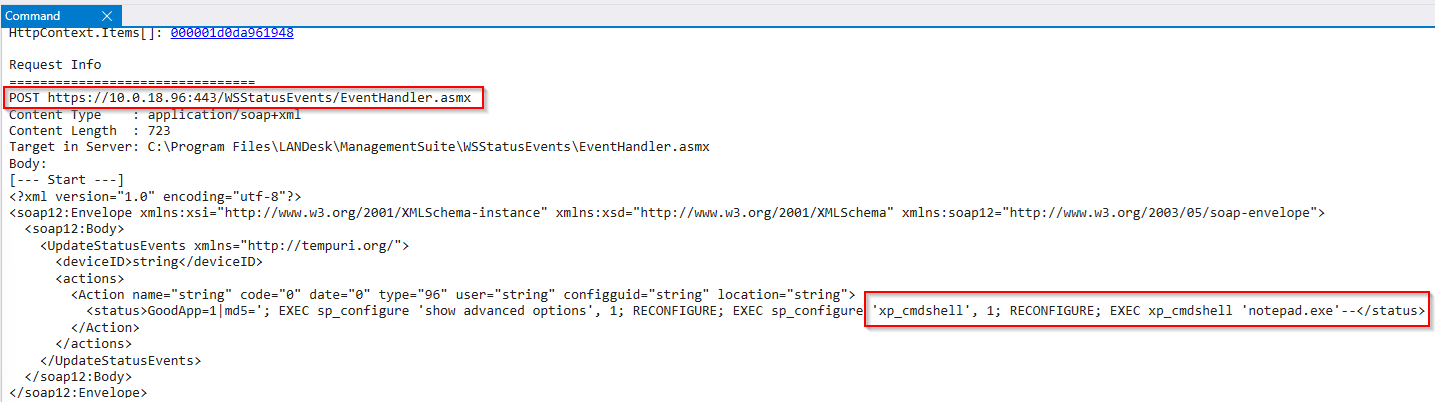
Found the vulnerable endpoint /EventHandler.asmx in the file w3wp (5).DMP with the full URI of the POST request. Using netext, we can also display the timestamp of the request as shown:
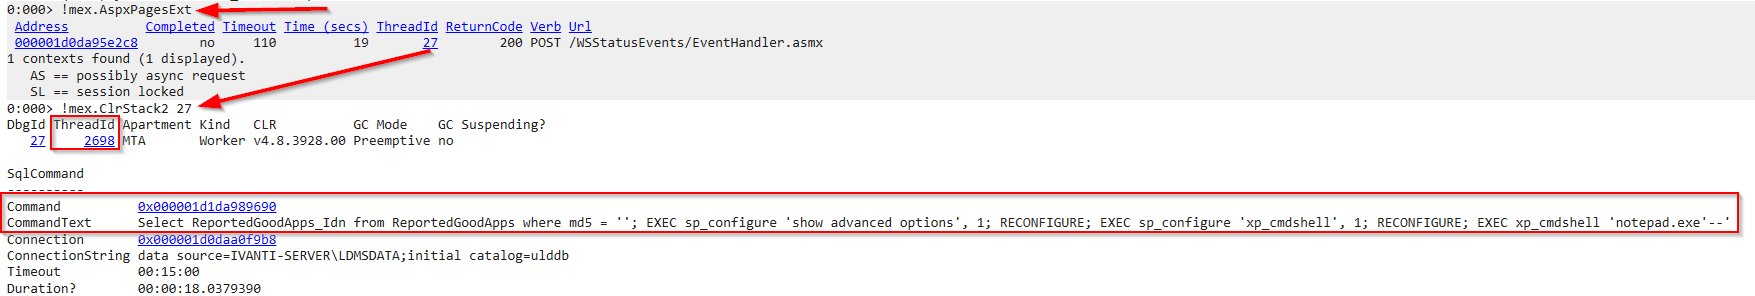
Different approach is by the MEX plugin again, The !mex.AspxPagesExt command provides stats for the processed ASPX pages requests which have run and currently running when the dump was taken.

Let’s display the structure and details of CLR objects in memory by !DisplayObj 0x000001d0da95e2c8 and get detailed view of the System.Web.HttpContext class objects (which contain all the information about the HTTP request).
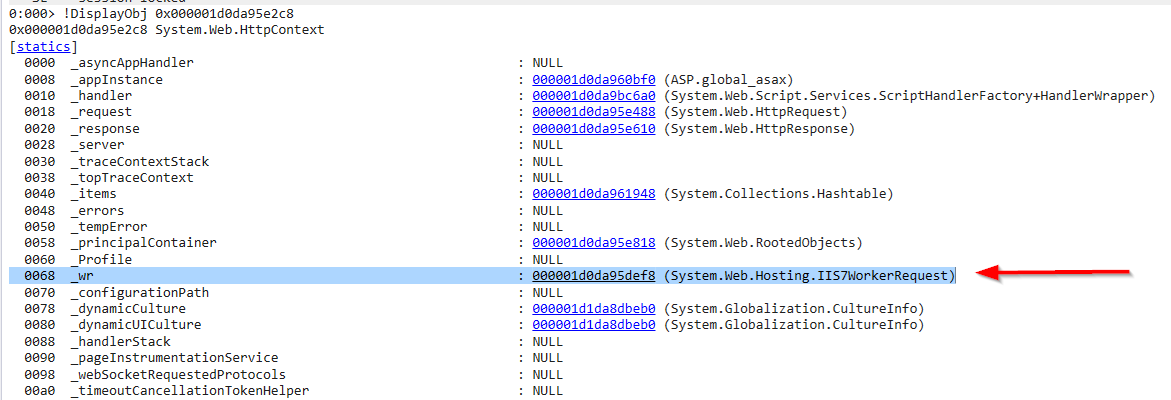
one of the objects is the (System.Web.Hosting.IIS7WorkerRequest) at 000001d0da95def8 which provides information on the status and properties of an IIS worker request (such as the request headers, HTTP method, content types, UTC time etc.) so it handles the HTTP requests and responses between the server and the ASP.NET application.
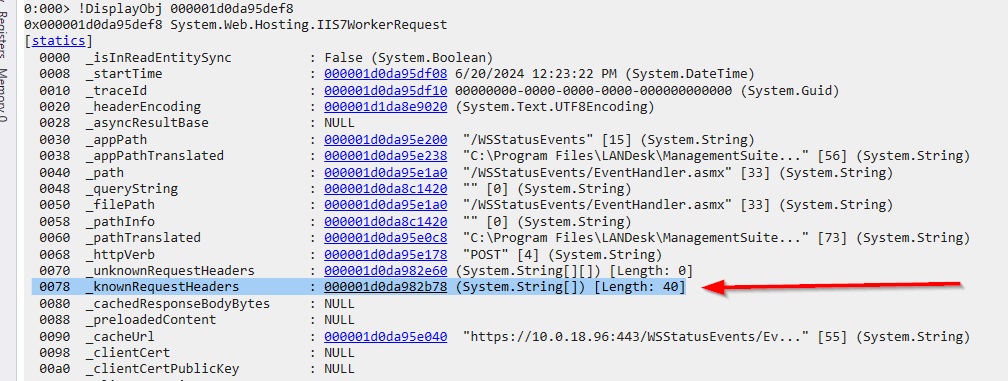
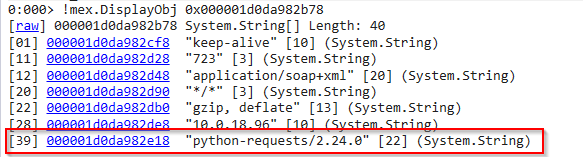
displaying the _knownRequestHeaders field as mentioned in the screenshot above, we get an array of known HTTP request header values where we can see a User-Agent string python-requests/2.24.0
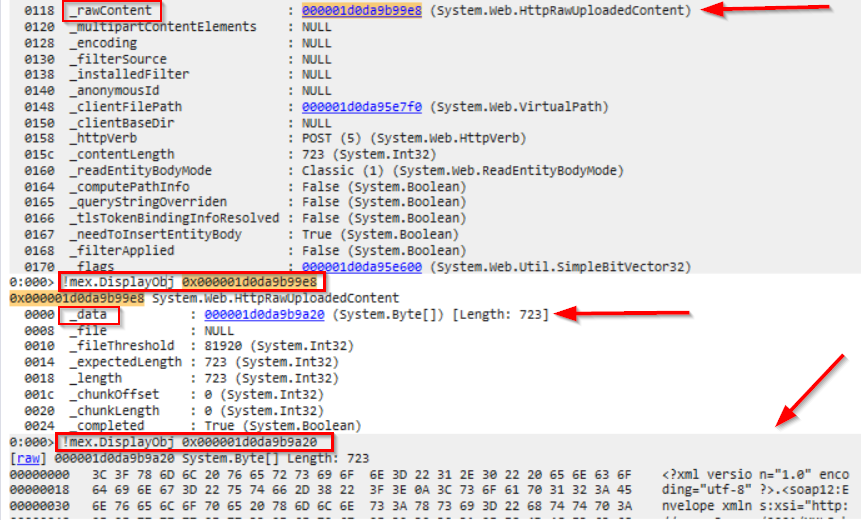
An important item displayed from the class System.Web.HttpContext is the _request (the System.Web.HttpRequest class) , from which we can get the malicious submitted POST request data via the item _data :
or iterate over the HttpRequest objects via !ForEachObject -s -x "!do2 @#Obj" System.Web.HttpRequest
instead of displaying the detailed view of the System.Web.HttpContext class objects we can display the stack trace associates with the thread ID 27 , there are multiple ways of listing call stacks but I’ll use the mex plugin with the command !mex.ClrStack2 27 ,as shown the thread ID for the call stack that shows the execution of this SQL command is 2698 along with its parameters and variables.
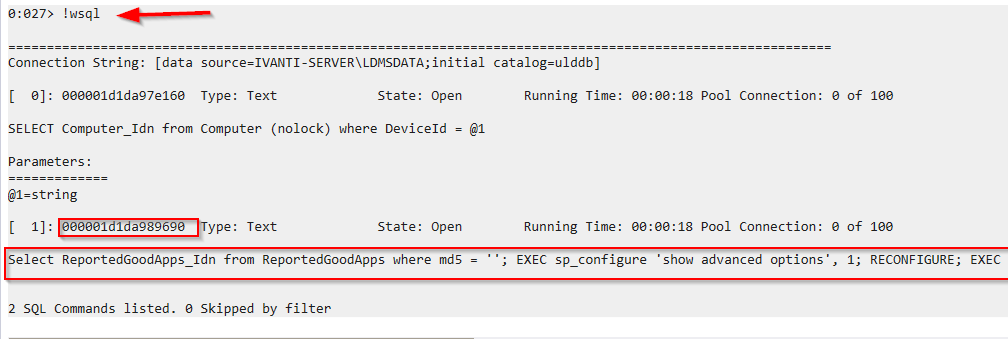
Another way to display all SQL server commands is by the netext command !wsql(via the .NET class System.Data.SqlClient.SqlCommand), we got 2 SQL commands lists and the malicious command execution address is 000001d1da989690 as shown:
Sqlservr Process
After confirming the suspicious trivial request using xp_cmdshell to gain RCE lets switch to examining it in the dump file of the sqlservr process (sqlservr.DMP):
Navigating between threads is crucial when working with memory dumps. using the command ~* k we can display the call stacks for all threads in the current process.
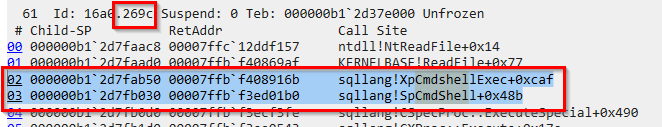
Upon searching for cmdshell got two call stack hits. The screenshot shows the call stack entries indicating that `XpCmdshellExec’ was invoked.
- The process id is 16a0 (5792) and the thread number is 269c (9884)
XpCmdshellExecis a function related to thexp_cmdshellstored procedure in SQL Server, which allows execution of shell commands directly from SQL Server.
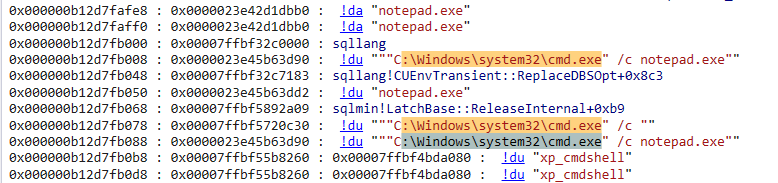
Finally, by using the PDE.dll extension with the command !pde.dpx (which displays various types of information such as stack traces and object properties), dumped the command that was executed to spawn notepad.exe, as shown in the output.
2. CVE-2023-29357
Xintra Scoping Note & Context
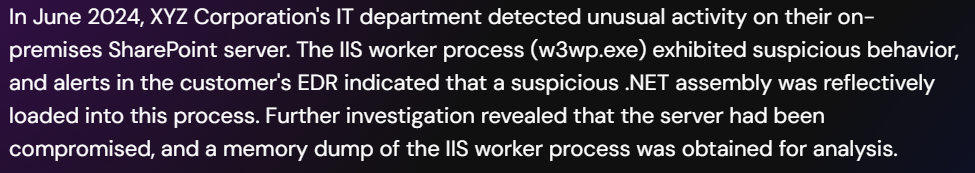
The second part of the lab involves a user-mode dump of the IIS worker process related to the SharePoint vulnerability (CVE-2023-29357). Analyzing this dump is crucial for detecting signs of exploitation and identifying artifacts associated with this CVE, similar to our approach with the previous one.
CVE Technical analysis & POC
w3wp Dump Information
The IIS worker process (w3wp.exe) hosts SharePoint web applications, processing user requests and executing sharePoint code to deliver content, so we will start doing same approach as the previous analysis, gathering some info and exploring the CVE related artifacts or objects:
using netext displayed the dump info and the user account details:
.load netext; !windex; !wvar
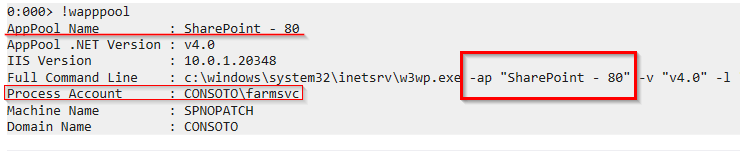
we can make use of the netext plugin and use the command !wapppool to display AppPool details (Application Pool name, hostname and user account)
there is the command !wruntime that can be used to display the running time of the Application Pool:
HTTP-Specific Information
Since this process handles web requests for an IIS web application, and after understanding the exploit’s technical details, lets check the HttpContext objects with the !mex.AspxPagesExt command it gives stats for the processed ASPX pages requests:
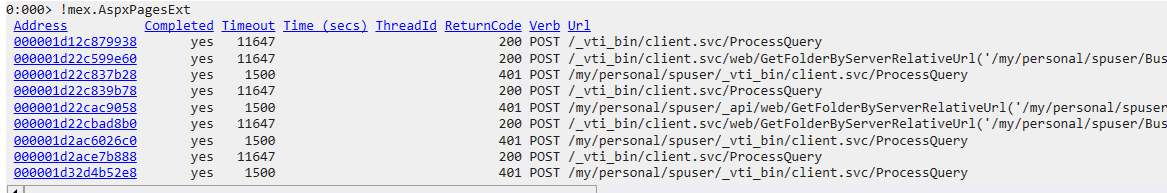
As shown first request made to /_vti_bin/client.svc/ProcessQuery to obtain a reference of the desired LobSystemInstance
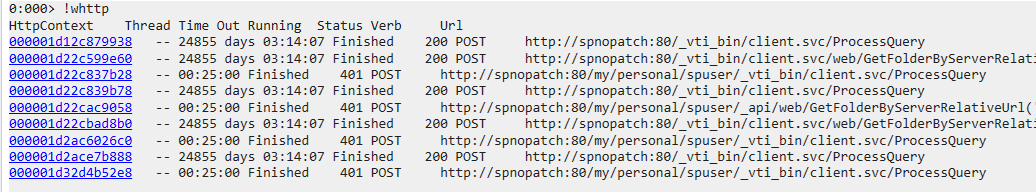
Using the command !DisplayObj 0x000001d22c599e60 displayed the URL of the second successful POST requests objects’ then the _url object from the class System.Web.HttpRequest by !mex.DisplayObj 0x000001d2ac445190


another easy way is via the plugin netext by the command !whttp to List the HttpContext objects
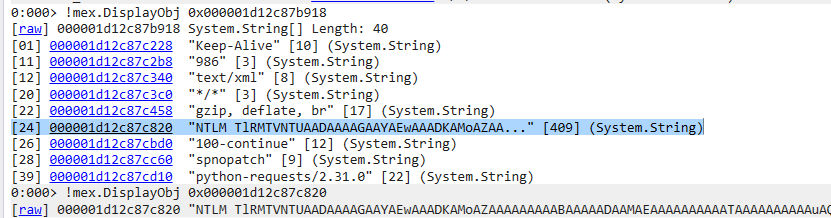
there is also the _headers field from which we can display the System.Web.HttpHeaderCollection class info by !mex.DisplayObj 0x000001d12c87b5c8 and get the attacker’s user agent:

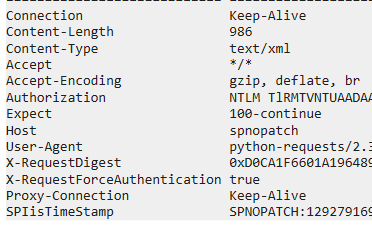
we can also review the _knownRequestHeaders field in the System.Web.Hosting.IIS7WorkerRequest class and get same info.
One of the interesting headers above is Authorization, it’s Base64 encoded string with the signature of NTLMSSP, decoding it we get the the name of the compromised user spuser that is used to make the malicious POST requests.
We can dump the body of the malicious POST request by iterating over the HttpRequest objects via !ForEachObject -s -x "!do2 @#Obj" System.Web.Hosting.IIS7WorkerRequest and searching for <?xml cause as mentioned in the technical analysis of the CVE, the attacker injects arbitrary code by replacing the BDCM catalog fileDCMetadata.bdcm which is XML based.
Searching the output got the body of the malicious POST request that was used to load the .NET assembly reflectively in the _preloadedContent field as shown:

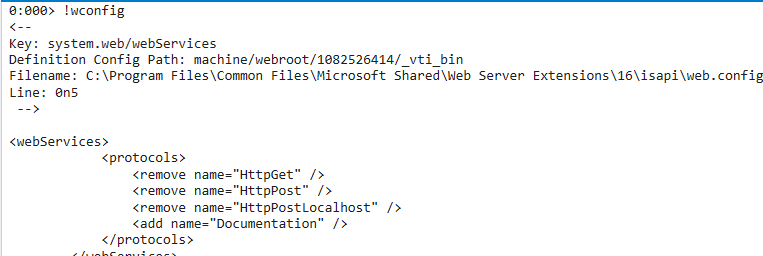
Before we jump to the reflectively loaded .NET assembly details, we can dump the Web.config file lines (which contains various configuration settings and behaviors of an application hosted with IIS) with the command !wconfig.
Reflectively loaded .NET assembly
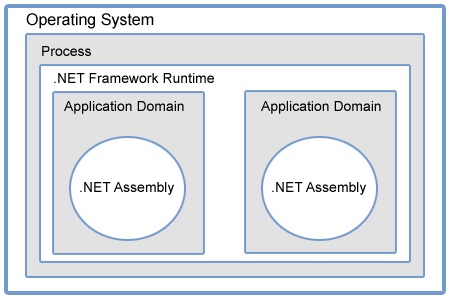
In an ASP.NET application, loaded .NET assembly (dll/exe) might directly or indirectly interacts with the ASP.NET cache to improve performance, Moreover the assemblies are loaded into the AppDomain and executed, let’s investigate each further.
To check the ASP.NET cache, we can use the !mex.AspNetCache command. From the output one of the objects is System.Reflection.RuntimeAssembly which represents a loaded .NET assembly in the application’s memory.
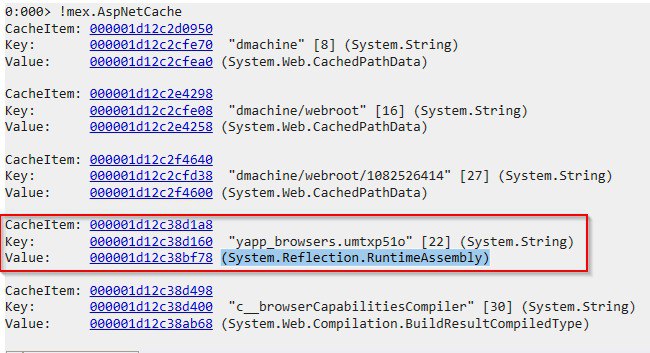
cool we dumped the ASP.NET cache and found a loaded .NET assembly evidence, now let’s jump to the AppDomain.
AppDomain ?
In ASP.NET, an AppDomain (Application Domain) is a logical container that isolates applications running within the same process, such as
w3wp.exeprocess can host multiple ASP.NET applications simultaneously. Each ASP.NET application runs in its own AppDomain, ensuring separation of application data, configuration, and preventing errors in one application from affecting others within the same process.
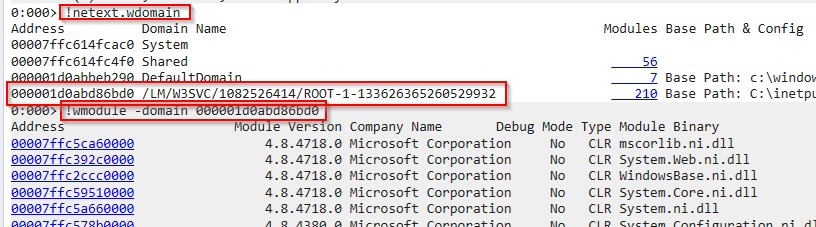
Executing the command wdomain to dump all the application domain information [name, base folder, config file and modules loaded(dlls)] we get a domain under /LM/W3SVC which is associated with ASP.NET application running under IIS LM stands for “Local Machine” and W3SVC is the service in IIS responsible for managing HTTP requests.
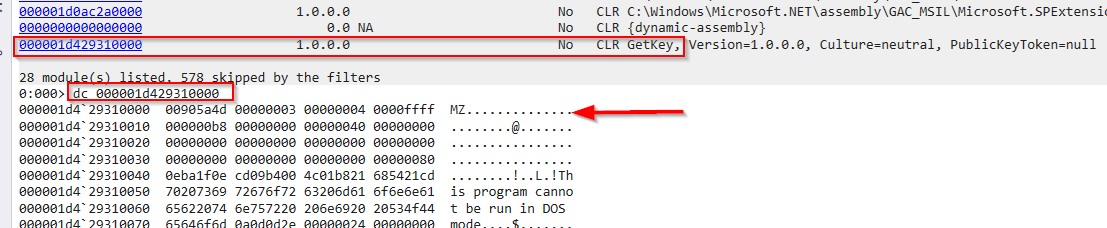
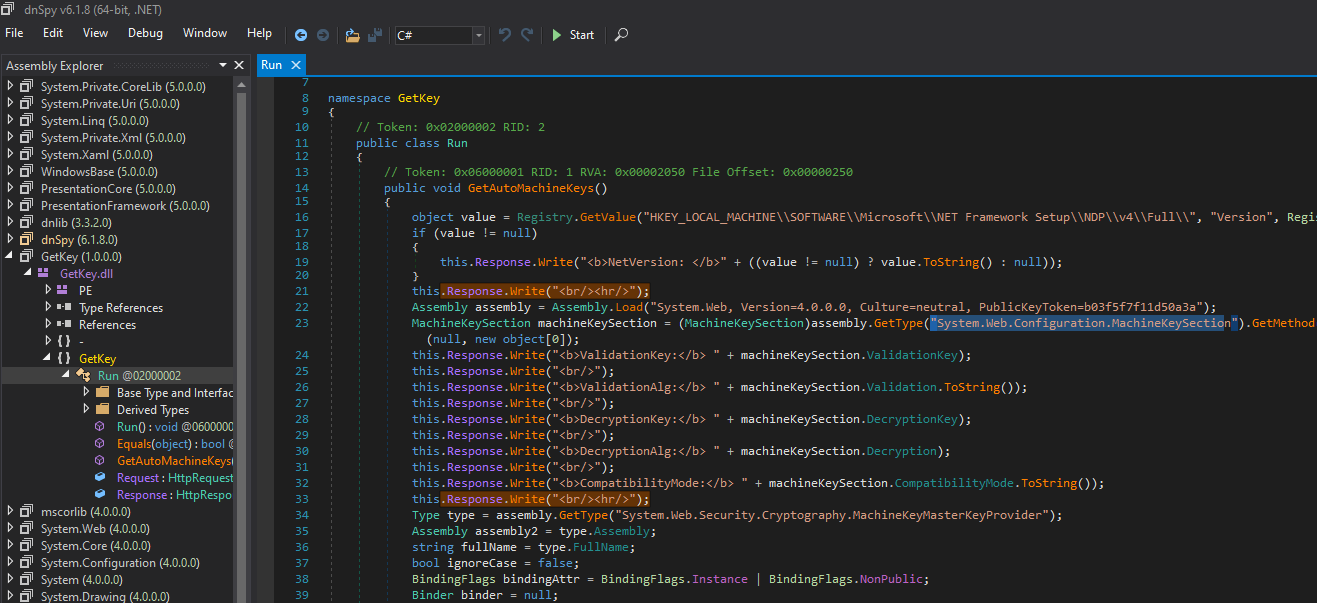
Passing its memory address to wmodule loaded a module named Getkey that doesn’t look right. It has a completely different style of name to the other modules.
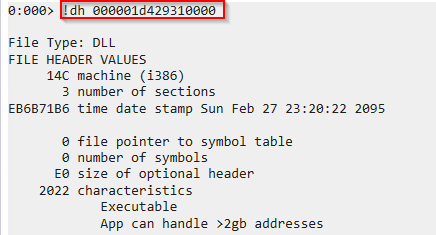
dumping the content of it shows the hexadecimal dump begins with MZ, using !dh command (Dumps headers from an image) confirmed that it is a DLL
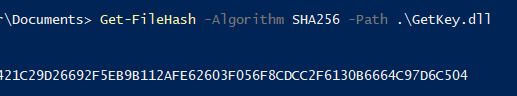
Now we can pass its name and dump it via wmodule using the command !wmodule [-name <partial-name>] [-saveto <folder>] in order to fingerprint and analyze the image.

Using dnSpy to analyze the dumped assembly, found it reads the .NET version from the registry and retrieves the machine key (validation and decryption keys) enabling the creation of malicious ViewState for further exploitation through deserialization attacks.
For more details, check these two great blog posts: stealing auto-generated .NET machine keys (contains the poc code too) and Exploiting Deserialisation in ASP.NET via ViewState.
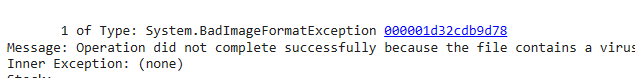
Although the malicious .NET assembly was loaded reflectively, it was unable to execute its malicious code and an exception was generated.
Dumping all exceptions with command !netext.wdae, got an exception type System.BadImageFormatException that was thrown preventing the DLL from running successfully and the field _innerException contains the reason of the exception.
Finally big thanks to @DebugPrivilege and to the Xintra team for their realstic labs.
If there any feedback fell free to contact me on Linkedin.

3. Resources
The entire repo of @DebugPrivilege ❤️
Notes and topics towards mastering Windows Internals
Windows Debugging and Troubleshooting Talk
Intro to Debugging a Memory Dump
The Memory Dump Analysis Anthology by Dmitry Vostokov
ProcDump deep dive - From the Sysinternals Playlist
View State, The unpatchable IIS forever day being actively exploited